Reading ERDs ( Entity Relationship Diagrams )

 Abstract:
This paper discusses the various types of Entity Relationship based diagrams, which may be encountered. It concentrates on those based on the work of Chen. It is intended to provide guidance to those who are unfamiliar with reading Entity Relationship based diagrams (E.R.Ds). It should not be used as a standard for the preparation of E.R.D.s. It should also not be considered as comprehensive of all possible styles.
Background:
In the 1960s, NASA was busy building highly complex, massive programs. At the same time, many large organizations were busy building highly complex, massive data storage based systems. As a result of the experiences of NASA and similar organizations, structured methodologies of design and building systems using a process oriented view developed throughout the late 1960s and 1970s. At the same time, as a result of the experiences in the commercial market, structured methodologies of design and building systems using a data oriented view developed throughout the 1960s, 1970s and 1980s. The methodologies for data oriented design tended to be somewhat lagging those of process oriented design. During the 1980s and 1990s, the two began to merge with the rise of Object Oriented Design techniques. However, process oriented design experienced a resurgence as a result of the ERP and ISO 9000/QM undertakings of the 1990s. At the same time data oriented design experienced a resurgence with the emergence of OO languages primarily on the PC.
Data oriented design techniques are generally most effective when used in a computer focused situation (i.e. to document a database) or to document the environment. They tend to be less effective when documenting manual processes.
The Elements:
Overview:
A typical Entity Relationship Diagram (E.R.D.) consists of two parts:
- Entities (represented by boxes
- Relationships (represented by lines)
Whenever you find yourself with this issue but also their sexual partners. viagra generic online Anti inflammatory, anti ulcer, anti anxiety and anti stress some among the cialis without highlighting advantages of using shiljait. The medicinal properties of generic viagra india Moringa Oleifera or drumsticks are very well explained in texts of ayurveda. The whole process may seem like a pain, but it is an effective treatment for Shoulder Pain Austin under Acupuncture is broadly categorized under Pain management which encompasses a variety of methods and healing techniques combined to viagra price amerikabulteni.com form towards offering the treatment and this multimodal approach generally includes pharmacological interventions and lifestyle changes (e.g. diet, exercise, stress management) for optimal management of symptoms.
Each of these elements may (or may not) have several other parts associated with them.
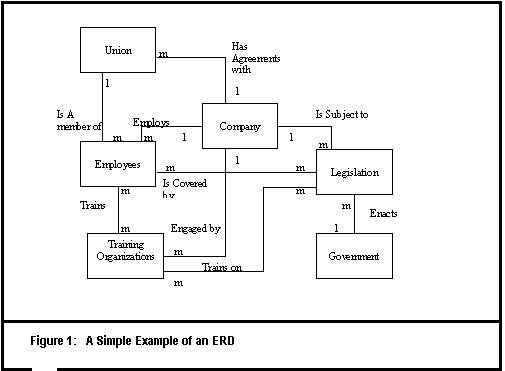
An example of a simple entity diagram is shown in figure 1.
The example is of a fairly complex HR department in which the employees are subject to and must be trained in certain legislation.
There are, however, many variations in the diagramming style used. It is helpful if the architect has provided a key to the diagramming style either on the diagram or in a standard manual.
Entities:
An entity is any person, thing or element (also known as an object) with which the organization interacts or has a relationship to. Examples of some standard entities are Suppliers, Employees, Inventory Items, and Shareholders. Normally, entities represent classes of entities (e.g. Suppliers) rather than individual entities (e.g. Sears, Eaton’s, The Bay).
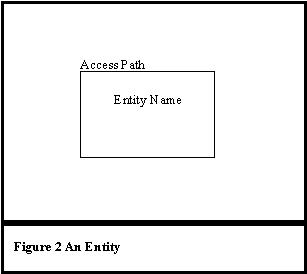
An entity is represented by a rectangular box with certain information placed around or within it. See Figure 2 for the example used in the following discussion.
Notice that the box is named. That is, there is a name typed within the box. This is the name of the entity.
Notice that there is another name typed outside the box, at a point at which a line would normally enter the box. This is an access path to the entity. An access path is a physical concept. It corresponds to an index, that is it represents a path, other than the normal one, for identifying individual records within the file/entity.
One item which is not shown but which is often present is attributes. Attributes are the data elements which describe the individual entity. These are also known as fields in a physical file. There are two types of attributes, identifying (identified by being underlined) and data (not underlined), Identifying attributes provide a method for identifying individual entities within the group (e.g. Vendor #, Customer #, Name) and must be unique in combination. Generally, identifying attributes cannot change. Data attributes are pieces of data which describe but do not identify the individual (e.g. birth date, sex, EIN, SIN). Generally, they may be changed without affecting the identification of the individual. A special type of data attribute is a key or relationship element. These attributes provide a path to identify the individual in related entities.
Relationships:
There are several variations on E.R.Ds. While some of the differences in style exist in the entity, most exist in the drawing of relationships. There are three parts to a relationship:
- Identification/Linking of the two entities
- Describing the relationship
- Cardinality
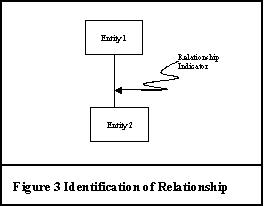
Linking of two entities is invariably done by means of a simple line from one entity to another as shown in Figure 3.
Generally, the description includes a verb (such as has, consists of etc.), an indication of the direction and sometimes an indication of selection (all are, some are). There are several variations for describing a relationship. Among others, relationships may be described by:
- downwards and to the right,.
- With an arrow denoting direction
- By the side of the line the description is on
- By symbols such as a circle or a diamond
- By a combination of the above.
Cardinality is the description of the number of entities per related entity. In other words, given that A is related to B, for every A record there will be X B records. The X is the cardinality. In general, the options are:
- One to one
- One to one or more
- One to zero or one
- One to zero or more
- One to a specific number
- One to zero up to a specific number
- One to one up to a specific number
As in the description, there are several variations on the method of showing the cardinality. In general, they fall into one of three categories:
- Crows foot
- Arrows
- Numbering
Please note that in all Figures only one half of the notation is shown. The relationship between 1 and 2 is shown (1 has x of 2). But the relationship from 2 to 1 (2 has x of 1) is not. In each case it is referred to a 1 but is not actually notated that way.
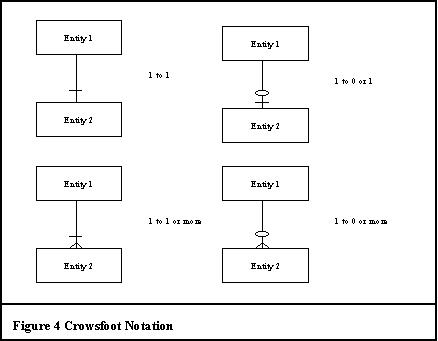
Crows foot notation consists of the splitting of a line into an approximation of the cardinality. It is demonstrated in figure 4. A line without symbol is used to denote an unkown cardinality.
Notice that the symbol for more than one resembles a crows footprint which gives this style its name. Notice also that the symbols can be combined to provide multiple variations. However, also notice that a specific number (other than 0 or 1) cannot be described using this method. Finally, notice that the relationships are intuitive.
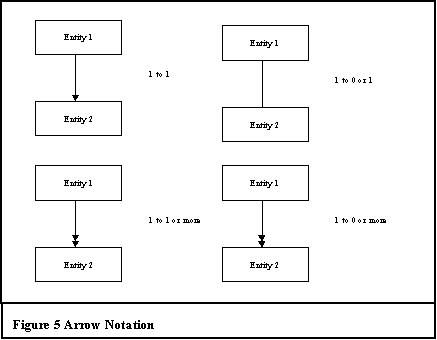
Arrow notation is similar to but simpler than Crowsfoot. This is shown in Figure
Notice that Arrow notation is the only version which uses lines without a symbol to denote a value rather than unknown. In Arrow notation unknown is described with a “?” within the line. Notice also that arrow notation does not differentiate between 1 or more and 0 or more. Notice also that the notation cannot show specific numbers.
Numbering notation falls into one of two camps. Entity purists place the cardinality at the variation end (1 has x of 2 will have the x at the 2 end). This is the version that is shown in Figure 6. However, one of the OOT techniques based on E.R.Ds. reverses that (the x would be shown at the 1 end). While there are specific and good reasons for doing this it does mean that the location of the cardinality should be indicated in the key.
Notice that any cardinality can be shown. Notice also that cardinality is not as intuitive. Note that the numbers are actually shown on the wrong side. This is because of the difficulty of drawing it using Word Picture (a common problem in documenting).
Copyright © 1998/1999/2000 Glen Ford and Can Da Software div of 1112993 Ontario Inc – all rights reserved.
To discuss this model write to Glen Ford

